You will find some math vocabulary on the SAT: words that may sound familiar and whose meaning may be the key to finding the correct answer. You will definitely come across these words as you study for the SAT math section. You’ll want to familiarize yourself with them in order to do your best on the math section!
The list of terms below covers the main math vocabulary terms you should know for the SAT. Use this post as a quick reference while studying, or as a jumping-off point for your own investigations into these math terms!
Math Vocabulary Terms to Know for the SAT Test
Prime number (composite number)
A prime number is a number that is only divisible by 1 and itself, like 7, 13, or 41. Not all prime numbers are odd: 2 is the only even prime. And not all odd numbers are prime: 51 seems prime but is divisible by 3 and 17. A composite number is a number that is not prime: a number that is divisible by more than just 1 and itself.
Irrational Number
An irrational number is a number that cannot be written as a fraction: it can be written as a decimal but it continues infinitely without repeating. “Pi,” the square root of 2 (or the square root of any number that is not a perfect square), and “e” are common irrational numbers.
A perfect square number is the product of a number and itself, thus the square root of a perfect square is an integer: 5*5=25, thus 25 is a perfect square number. The square root of 25 is 5.
Integer
An integer is a positive or negative whole number. So no decimals; but, a fraction could be an integer if it simplifies to a whole: 10/5 simplifies to 2, thus technically 10/5 is an integer… but 5/10 only simplifies to 1/2, thus 5/10 is not an integer.
Divisible & Quotient
When was the last time you heard divisible or quotient? Do you remember? Divisible means that a number can be divided by another number “evenly” or without having a remainder. So 18 is divisible by 3 because 18/3=6. The Quotient is the answer to a division problem, so in the previous example, 6 would be the quotient.
Factors & Multiples
These are words you definitely knew at one point…but remembering them cab be key to banking easy points on the early questions of both math modules on the DSAT. A factor is simply a number that “goes into” your larger number: something by which it can be divided. If you’re looking for the Greatest Common Factor of two numbers, it’s the biggest number by which both of them can be divided evenly (guess and check if you need to!). A multiple is like the opposite of a factor: it’s the product of multiplying that number by something. For example, 10 is a multiple of 5 (because you can multiply 5 by 2 to get 10), but not a multiple of 7 (because there’s no way to multiply 7 by an integer to get 10.) The Least Common Multiple is the smallest number that is divisible by the factors given to you. Note that Desmos can do both of these calculations for you!
Domain, Range, and Restricted Domain
The domain is the set of possible values of x of the function (all possible inputs, or when graphed, any possible value along the x-axis). When looking at a graph, you can determine the domain by examining the graph from left to right, find the lowest x-value and the greatest x-value.
The range is the set of possible values of y of the function (all possible outputs, or when graphed any possible value along the y-axis). When looking at a graph, you can determine the range by examining the graph from bottom to top, find the lowest y-value and the greatest y-value.
The restricted domain is when a function is only defined for certain values. For example, f(x)= square root (x) is only defined for positive x-values; thus, the domain of f(x) is x>=0. Often a restricted domain will affect the range. For example, since the domain of f(x) is x>=0, the range of f(x) is y>=0.
Parallel and Perpendicular Lines
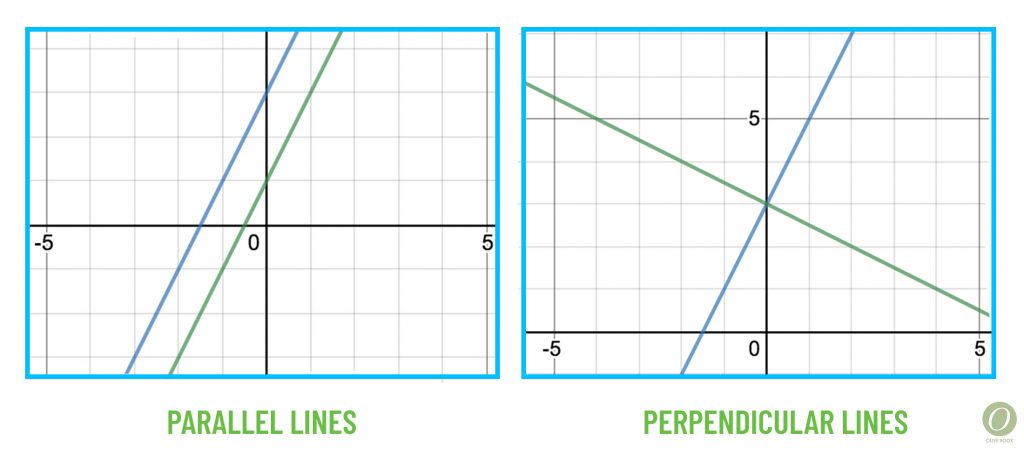
Parallel lines lie in the same plane and do not intersect; the lines also have the same slope.
Perpendicular lines lie in the same plane and intersect to form a 90-degree angle; the lines also have slopes that are opposite reciprocals of one another. For example, if one line has a slope of -2, a perpendicular line would have a slope of 1/2.
Zeros, Solutions, X-Intercepts
When asked to solve a quadratic equation, there are several words that the question my use. The question could ask for “the zeros of the function” or “the solutions to the equation” or “the x-intercepts” of the graph. In any of these cases the process is the same: set the function/equation equal to 0 and solve. You can solve by factoring then setting the factors equal to 0; using the quadratic formula; or by graphing and identifying where the graph crosses the x-axis.
What Calculator to Use on the SAT
Exponential
So we know that an exponent is the small number in the top corner of something like x2. Exponential is used to describe a type of function or a type of increase or decrease.
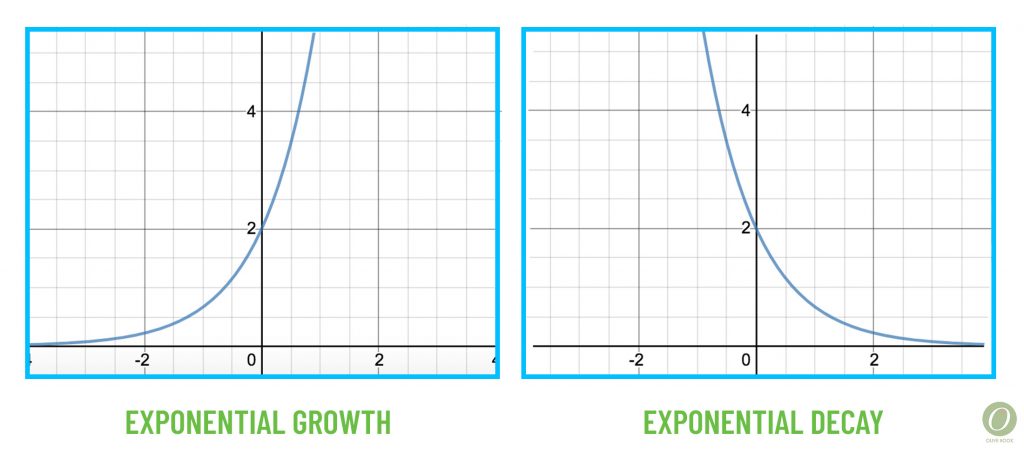
An exponential function is when the variable is the exponent. For example, f(x)=1000(.8)x might represent a population of 1000 frogs that are decreasing at a rate of 20% per year, where x represents the number of years that have passed.
Exponential growth and exponential decay are words used to describe how a function or graph is changing. In the frog example, this is exponential decay because the population of frogs is decreasing and the function used to model this decay is exponential.
Function Notation
Function notation is another way to express a relationship between two variables. (There is such a thing as a Multivariate Function which can express a relationship between more than two variables… but you will not see such a beast on the SAT.) Take f(x) = 2x+4 — the f(x) part represents the output, similar to the y-values. The x is the input. The 2x+4 part is the function rule; it tells you what to do to the inputted value.
So f(5)= 2(5)+4=14, thus f(5)=14. Or maybe f(3x)=2(3x)+4=6x+4. Or maybe f(x)=20 then 20=2x+4, thus x=8 because f(8)=20.
Just remember that you input whatever is in the parenthesis, and the f(x) part is the output.
Parallelogram (and a quick recap of other quadrilaterals)
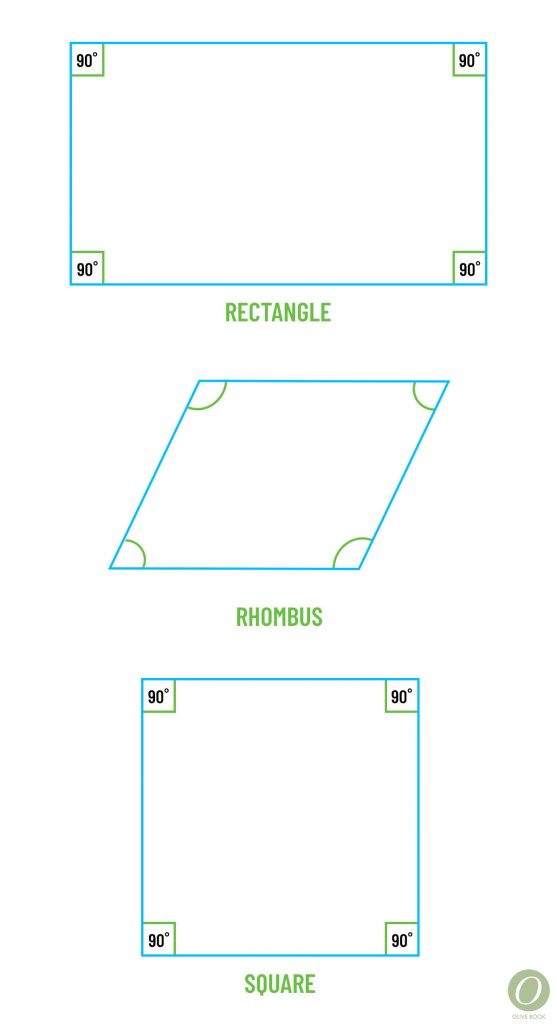
A parallelogram is a 4-sided polygon with 2 pairs of opposite congruent sides, 2 pairs of opposite parallel sides, 2 pairs of opposite congruent angles, and diagonals that bisect each other (but are NOT congruent).
A rectangle is an equiangular parallelogram: all angles measure 90 degrees and the diagonals are congruent.
A rhombus is an equilateral parallelogram: all sides have the same measure and the diagonals perpendicular (but NOT congruent).
A square is a regular parallelogram: all angles measure 90degrees, all sides have the same measure, and the diagonals perpendicular & congruent.
Mean, Median, Mode, Range, Standard Deviation, Central Tendency
Looking at the measures of the central tendency of a set of data can help you to understand trends and draw conclusions. Depending on the data, a different measure of central tendency can be more or less helpful in drawing conclusions.
The mean is the arithmetic average of the data. It is found by dividing the sum of all the values by the number of values.
The median is the middle value when all the data is arranged from least to greatest.
The mode is the data value(s) that occur the most in a set of data.
The range is the difference between the greatest value and the least value in a set of data.
The standard deviation shows how spread out the data is. Thus the standard deviation is low if most of the data points are near the mean value and high if most of the data points are far from the mean value.
SAT Math Strategies
SAT Math Study Guide
Line of Best Fit, Positive Correlation, Negative Correlation, No Correlation
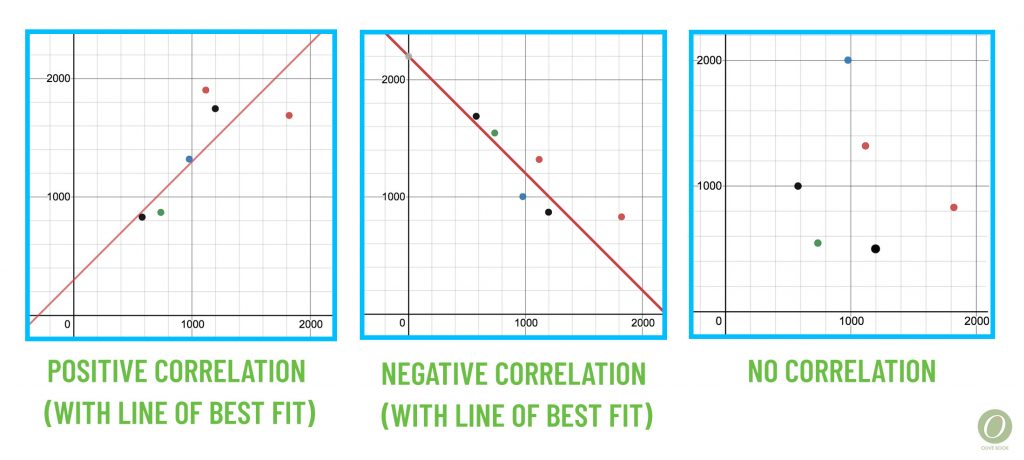
The line of best fit is just like what it sounds like! It is a line that models the way a set of data is increasing or decreasing. The slope of the line will be positive if the data has a positive correlation, trending up. The slope of the line will be negative if the data has a negative correlation, trending down. It is possible for data to have no correlation when the data is so spread out that it neither trends up nor down.
Counting Principle, Permutation, Combination, Possible outcomes/options
You use the counting principle when you are selecting one item from several groups of items.
For example, let’s say you are getting dressed and have 4 pairs of pants, 7 shirts, and 3 pairs of shoes. You want to select 1 pair of pants, 1 shirt, and 1 pair of shoes. To determine the number of possible outcomes or possible options, you simply multiply the number of items in each group: 4*7*3=84. Thus, you have 84 possible outfits… though we all know not every pair of pants goes with every pair of shoes!
You use permutation when you are asked to select several items from a group and the order in which you select matters. For example, let’s say there are 15 people in your SAT/ACT Prep Club, and you want to elect a president, vice-president, and treasurer. Thus, you are selecting 3 from a group of 15 where ABC is definitely different from CBA… I mean, it definitely makes a difference to Ashish who went from President to Treasure and to Carley who went from Treasurer to President.
Thus, you would use permutation to solve this: P(15,3)=15!/(15-3)!=2,730. So you would have 2,730 possible outcomes or options for electing a president, vice-president, and treasurer out of a 15 member club.
You use combination when you are asked to select several items from a group and the order in which you select does not matter. For example, let’s again say there are 15 people in your SAT/ACT Prep Club, and your club has the opportunity to take a canoe ride. Unfortunately, only 3 people can fit in the canoe. Thus, you are selecting 3 from a group of 15 where ABC is NOT different from CBA… I mean, does it make a difference if Ashish gets on the canoe before Carley does??? No! You are either on the canoe or not! Thus, you would use combination to solve this: C(15,3)=15!/3!(15-3)!=455. So you would have 455 possible outcomes or options for selecting 3 members out of 15 members to go on a canoe ride.
I remember the difference between permutation and combination by remembering that I use permutation to find President/Vice President options and use combination for who is on the Canoe!
45, 45, 90 triangle
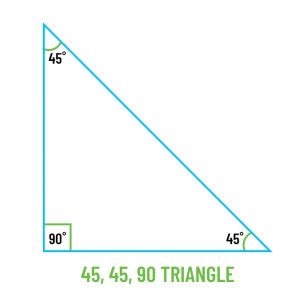
The 45, 45, 90 triangle is an isosceles (two sides are congruent) right triangle. You can create a 45, 45, 90 triangle by drawing a diagonal on a square. The ratio of the sides of a 45, 45, 90 triangle are 1:1:2. In other words, if you know the sides of the square measure 5, then you know the diagonal measures 52.
30, 60, 90 and Equilateral triangle
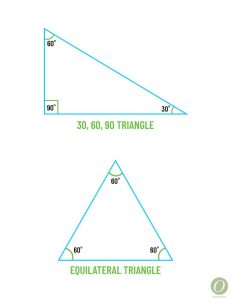
The 30, 60, 90 triangle can be created by drawing a median, altitude, angle bisector on an equilateral triangle (all sides of the triangle are equal in length). The ratio of the sides of a 30, 60, 90 triangle are 1:3:2. In other words, if you know the sides of the equilateral triangle measure 8 then you know the altitude or median measures 43.
Study Tips for Math Vocabulary
Of course, the best way to learn these terms is through frequent use. Find SAT math practice questions that use these math vocabulary concepts so you not only know what they mean but how to solve problems that incorporate them!
If you’re enrolled in Olive Book’s SAT course, the math section will cover every concept on this list. This makes your study plan easy: just visit www.olive-book.com, open the course, and start working away at the math section!
If you’re not enrolled in one of the courses, you can look up these math vocab terms and related practice problems in your math textbook or online.
Further Reading:
See Math Like a Mathematician
SAT Math Strategies
SAT Math Study Guide
What Calculator to Use on the SAT

